QGIS GUI
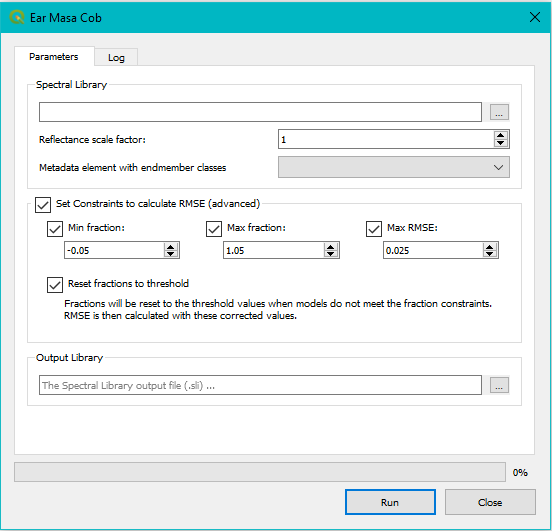
Select the input spectral library. Note that this library must have metadata attached to it and it is best sorted in a way to assist interpretation of the square array.
The reflectance scale factor is automatically detected.
Note
Spectral data can be saved to file as reflectance values (i.e. values between 0 and 1) or the data can be multiplied by a scale factor (usually by 1000 or 10000). This is done to be able to store the data as integer values (no comma’s), because integers require less memory. Although this is more efficient storage-wise, it has as a result we have to divide the data values again before processing.
The software tries to auto detect this scale factor, but does not always succeed. Double check this value before continuing.
Select the metadata element that divides the spectra in the library into classes.
Select if you want to use constraints for the SMA algorithm or not.
- Deselect the constraints-box to calculate the fraction and RMSE metrics without constraints. There will be no ‘constraints’ band in the output.
- Select the constraints-box to calculate the fraction and RMSE metrics with constraints. Thresholds can be set for minimum and maximum fractions and for RMSE.
- Select or deselect the ‘reset’ box to use the constraints in reset mode or non-reset mode.
Select an output filename. A default name is created for you with the structure libraryName_emc.sli.
Issue Tracker:
For issues, bugs, proposals or remarks, visit the issue tracker.