Creating/Editing a Spectral Library
So far, QGIS has no functionality for creating, viewing or editing spectral libraries. For that reason, we had to build this tool ourselves. It has several functions:
- Create a Spectral Library by manually selecting spectra from an image
- Create a Spectral Library by using Regions Of Interest (polygons/points)
- Open and inspect a Spectral Library
- Edit the metadata of a Spectral Library
- Remove profiles from the Spectral Library
- …
It speaks for itself that a thorough understanding of the research area is required to be able to build a Spectral Library from it.
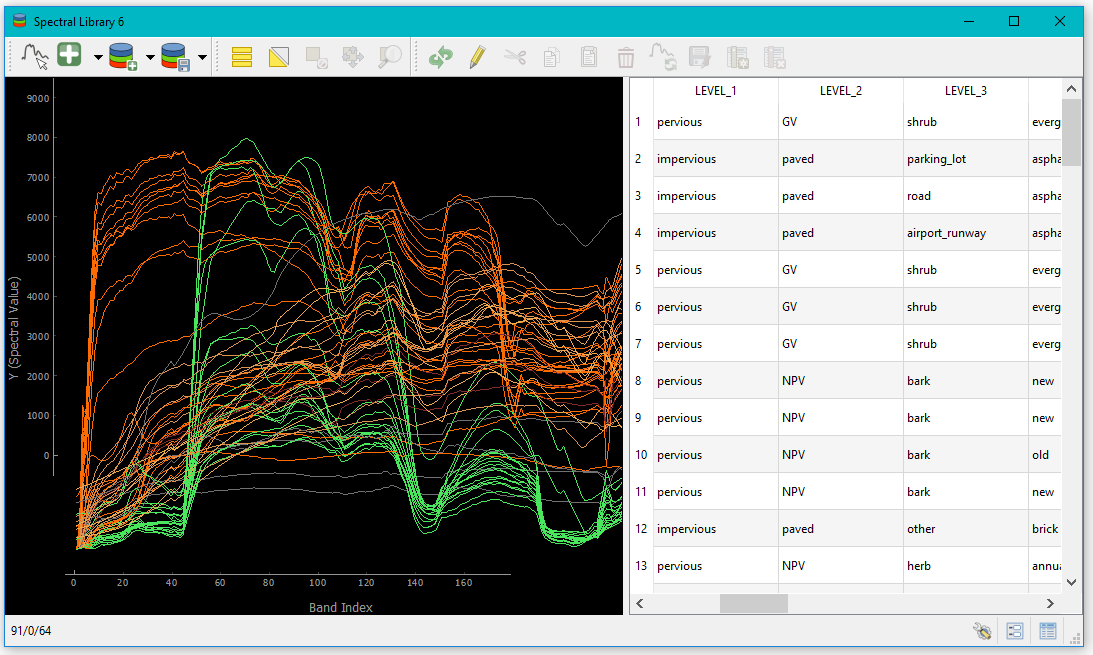
The table below gives a short overview of all Spectral Library specific buttons and their function:
 |
Select a new profile from a (hyperspectral) image |
 |
Add the currently overlaid profiles to the Spectral Library |
 |
Automatically add selected profiles to the Spectral Library |
 |
Import Spectral Library |
 |
Import profiles from raster + vector source |
 |
Save the current Spectral Library to file |
 |
Use colors from map vector symbology |
All other buttons are inherent to QGIS, but here is a short overview:
 |
Toggle editing mode |
 |
Toggle multi-edit mode |
 |
Save edits |
 |
Reload the table |
 |
Add feature |
 |
Delete selected features |
 |
Cut selected rows to clipboard |
 |
Copy selected rows to clipboard |
 |
Paste features from clipboard |
 |
Select features using an expression |
 |
Select all |
 |
Invert selection |
 |
Deselect all |
 |
Move selection to top |
 |
Select/filter features using form |
 |
Pan map to the selected rows |
 |
Zoom map to the selected rows |
 |
New field |
 |
Delete field |
 |
Conditional formatting |
 |
Actions |
 |
Form View |
 |
Table View |
 |
Show Spectral Library Properties |
Note
This is a highly interactive tool and has no command line equivalent.
Create Spectral Library manually
In order to select spectra from an image, first load an hyperspectral image in QGIS.
- Toggle the Select Profile button
- Click on a random pixel in the image to view a profile in the plot window. This profile is not automatically kept, and you can click as many times as you want in the image, until you find a good profile.
- Click on the Add button
- If you check the Auto button
- To remove a profile, select it in the attribute table and use the Delete button
- You can now edit the profile metadata, add or remove non-compulsory fields and zoom/pan to your selection on the image.
- Use the settings tool
Hint
You can view a subset of your data by only setting layer properties for a subset of classes! The spectral library behaves like a point shape file and so the styling behaves accordingly.
Create Spectral Library from ROI’s
To start with this step, you need a ROI (Regions Of Interest) file. This is a QGIS Vector Layer, with each feature representing an unmixing class (e.g. Pine trees). These classes, and other metadata, should be included in the attribute table.
- Make sure both the image and ROI file are open in QGIS.
- Click on Import profiles from raster + vector source
- You can now edit the profile metadata, add or remove non-compulsory fields and zoom/pan to the selection on the image.
Note
A Spectral Library will copy the attribute table of the ROI Vector Layer, it is therefore essential that it does not contain the following protected fields: ‘fid’, ‘name’, ‘source’, ‘values’ or ‘style’.
The attribute table of the ROI Vector Layer must contain an ‘ID’ field (spelled with all capitals) with unique integer values.
Open existing Spectral Library
To open an existing Spectral Library, use the Open Library button .
Save Spectral Library to file
To save the current Spectral Library use the Save Library button .
Note
All changes made to the Spectral Library exist in memory only, until they are saved to file.
ACKNOWLEDGMENTS
This user guide is very loosely based on the VIPER Tools 2.0 user guide (UC Santa Barbara, VIPER Lab): Roberts, D. A., Halligan, K., Dennison, P., Dudley, K., Somers, B., Crabbe, A., 2018, Viper Tools User Manual, Version 2, 91 pp.
The Spectral Library tool was created for the most part at HU Berlin, by B. Jakimow. More information on the source code: https://bitbucket.org/jakimowb/qgispluginsupport.
For issues, bugs, proposals or remarks, visit the issue tracker.