QGIS GUI
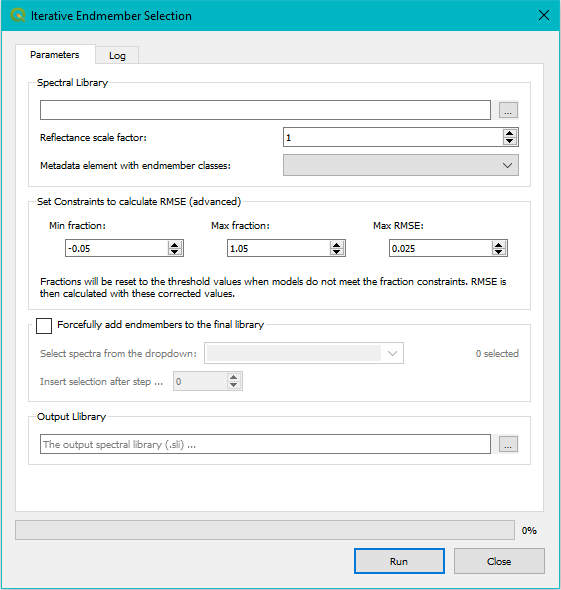
Select the input spectral library. Note that this library must have metadata attached to it and it is best sorted in a way to assist interpretation of the square array.
The reflectance scale factor is automatically detected.
Note
Spectral data can be saved to file as reflectance values (i.e. values between 0 and 1) or the data can be multiplied by a scale factor (usually by 1000 or 10000). This is done to be able to store the data as integer values (no comma’s), because integers require less memory. Although this is more efficient storage-wise, it has as a result we have to divide the data values again before processing.
The software tries to auto detect this scale factor, but does not always succeed. Double check this value before continuing.
Select the metadata element that divides the spectra in the library into classes.
Select the constraints for the fractions and the RMSE.
In case you want to use Forced IES:
- Select them from the drop-down menu.
- Indicate in which step you would like to include them. Mind that if the step larger than the final selection, the spectra might not be included in the final result.
Select an output filename. A default name is created for you with the structure libraryName_ies.sli.
While the IES algorithm is running, the user gets reports on the progress (adding and removing spectra) on the log screen.
Issue Tracker:
For issues, bugs, proposals or remarks, visit the issue tracker.